Analysis of Covariance via SPSS point and click
The following data represent a pre-post design, where a training program designed to assist people in losing weight is evaluated. An initial measure of weight is collected to use as a baseline measure (specifically as a covariate in the present analysis) and then participants are randomly assigned to one of two groups. At the end of the training program another measure of weight is obtained. The question of interest is: “did the participants who received the treatment lose more weight than those that were assigned to the wait-list control group?”
The analysis the data given in Table 9.1 is done by making use of the SPSS Univariate ANOVA procedure (UNIANOVA). The difference in this design compared to those examined previously is that a covariate is included in the analysis.
1. As before, we will begin by moving the grouping factor, group, into the Fixed Factor(s) box, and the dependent variable, y, into the Dependent Variable box. Because a covariate is also included in the analysis, the covariate, x, is moved into theCovariant(s) box.
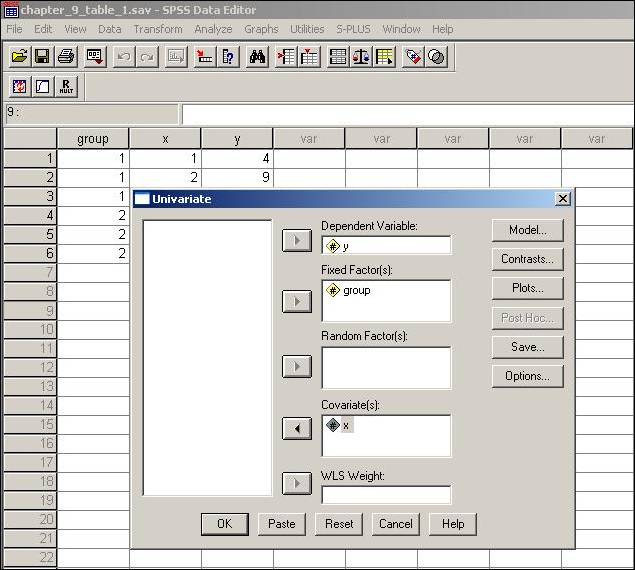
2. Because we are also interested in the parameter estimates of the intercept and slope, and not just the F and probability values associated with the effects, it will be necessary to add an additional option. By clicking on the Options button in theUnivariate box, the option for Parameter estimates can be “checked.”

